Here comes the telemetry
@jubianchi - 17 May 2016
Here comes the telemetry
@mageekguy, author of atoum, had the idea to provide a collaborative platform for atoum users so they can share their results and statistics. We did not had much time to work on such things until recently and we are now proud to announce the telemetry platform!
Here it is: https://dashboard.telemetry.atoum.org.
Telemetry?
Before getting into details, what is telemetry? Let’s see what Wikipedia tells us:
Telemetry is an automated communications process by which measurements and other data are collected at remote or inaccessible points and are subsequently transmitted to receiving equipment for monitoring.
This is exactly what we do with atoum and its telemetry report: We collect some data from your test suites and send them to a global platform so that we can monitor and analyze them.
We chose to make this an opt-in: atoum will not send any data unless you tell it to do so. Enabling this is easy but
can’t be done by mistake. If you want to send us your data, you will have to add the
reports-extension extension and enable the required report.
First, add the new dependency with Composer:
$ composer require --dev atoum/reports-extensionThen enable the report in your configuration file, .atoum.php:
<?php

use mageekguy\atoum\reports\telemetry;
use mageekguy\atoum\writers\std;

$script->addDefaultReport();

$telemetry = new telemetry();
$telemetry->addWriter(new std\out());
$runner->addReport($telemetry);
This will enable the telemetry report which is provided by the reports-extension: This extension provides many other
reports (Sonar, advanced code coverage, …), fell free to check out the repository and the
readme. Now each time you run your test suite,
results will be sent to the telemetry.
If the platform ever experiences downtime and atoum is unable to send the data it will not mark your test suite as failed: The telemetry report will gracefully report the HTTP error but won’t emit any failure or exception.
Because the dashboards are publicly accessible, by default everything will be sent anonymously. If you want to let us know who you are and which project is producing those data, you can add the following lines:
<?php

$telemetry->readProjectNameFromComposerJson(__DIR__ . '/composer.json');

// Or

$telemetry->setProjectName('my/project');
If you want to keep your project name secret, you can also add the following line:
<?php

$telemetry->sendAnonymousProjectName();
This is especially useful when reading your full project name from the composer.json file: The telemetry report will
keep the vendor name untouched but it will anonymize the project name.
What do we collect?
Now that you know how to enable the telemetry report, you might probably want to know what is collected from your test suites. atoum will compute some numbers about your test suites, here is the full list:
- Number of test classes,
- Number of test methods,
- Number of test methods by status (void, uncomplete, failed, …),
- Number of assertions,
- Number of assertions by status (failed and passed),
- Number of exceptions,
- Number of errors,
- Line coverage value,
- Branch coverage value,
- Path coverage value,
- Test suite duration,
- Memory consumption.
It will also tag them with informations about the execution environment:
- PHP version,
- atoum version,
- Operating system,
- Platform architecture,
- CI environment name,
- Vendor name,
- Project name.
Of course, if you chose to send anonymous data, vendor and project names will be anonymized.
The data we collect will be kept as long as possible. They will eventually be down-sampled each month to keep the database as small as possible without loosing anything.
Numbers, numbers, numbers!
Now you might ask what is the point of this platform. This is simple: We want to be able to measure things and improve them based on real feedbacks. Moreover, this feedback will be produced at no cost for users.
If you can’t measure it, you can’t improve it.
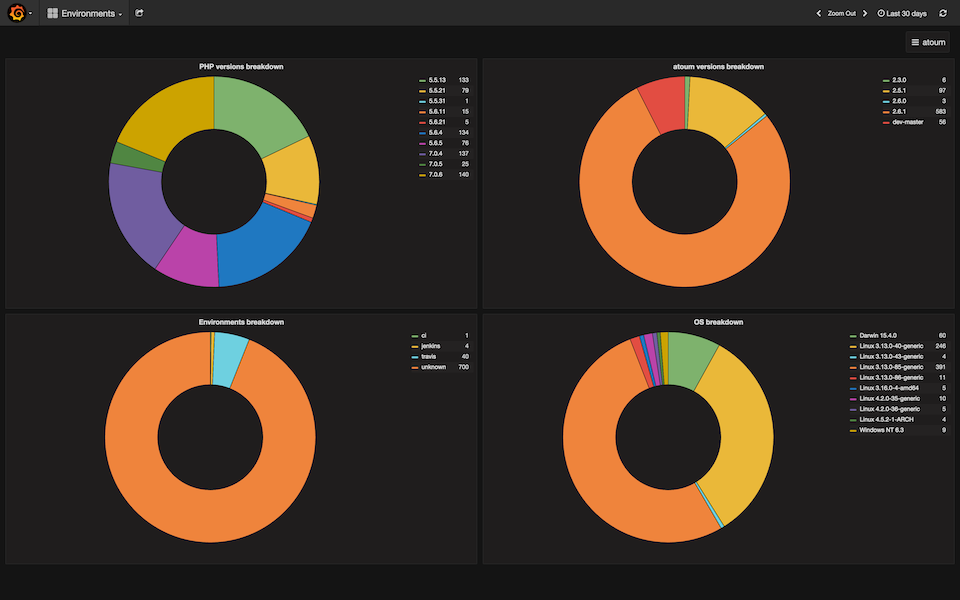
atoum has been written with TDD in mind. We often think TDD is limited to design and code. But one of its key concept is the feedback. Without this feedback you are left alone to make decision. Measuring things with the telemetry will let us make decision with real numbers. For example, if we want to deprecate a PHP version from the list of supported ones we’ll only have to look at the telemetry and see the usage breakdown to measure the impact of such a change.
We’ll also be able to monitor performances across releases of atoum: The telemetry will be notified by Github each time a new release is issued and annotate the graphs.
Collecting data about test suites size will let us have an idea of our users habits, see how they evolve and perhaps improve atoum to better match them.
Finally, we made those data public so anyone can see how atoum behaves and how it is used.
How does it work?
To make things as simple and reliable as possible we used well know tools, softwares and libraries to power the telemetry. Here is the list of things we use:
- The telemetry report is written in PHP and the atoum report API,
- The telemetry platform API is powered by Silex,
- The broker and worker are powered by php-resque which is a port of the well-known resque,
- It uses Redis to store the job queues,
- The time-series database is powered by InfluxDB,
- The dashboards are built on Grafana,
- Finally, everything is packaged and shipped using Docker and hosted on a Rancher platform,
- It uses HAProxy as the main load-balancer,
- SSL certficates are issued by Let’s Encrypt.
Basically, each time you run your test suite with the telemetry enabled, atoum will build a JSON report and send it to the telemetry platform API.
Once it receives a report, the platform will enqueue a job in a queue to handle the data. Then a worker will be reserved to send those data to the time-series database: The data are now available within the dashboards.
This seems to be a complex stack for such a simple workflow be it ensures each component is easily scalable and we can update them without making the whole platform down. We want to be able to collect the data you send at any time and eventually build a backlog of jobs to handle if anything goes wrong on the database side.
Everything is of course available as an open-source project: The repository is hosted on Github. If you want to have a more detailed view of how it works, feel free to look at the source code.
Moreover, you are free to use it to build your very own telemetry platform and make it private.
We hope you will like this platform as much as we like it. For us it will be a wealth of information and we hope you will be more and more to send us your data.